Content for TS 26.118 Word version: 18.0.0
C Registration Information
C.1 3GPP Registered URIs
D VR metrics calculation examples
D.1 Comparable quality viewport switching latency
D.2 Rendered viewports
$ Change history
C Registration Information p. 83
C.1 3GPP Registered URIs p. 83
The clause documents the registered URIs in this specification following the process in http://www.3gpp.org/specifications-groups/34-uniform-resource-name-urn-list
Table C-1 lists all registered URN values as well as:
- a brief description of its functionality;
- a reference to the specification or other publicly available document (if any) containing the definition;
- the name and email address of the person making the application; and
- any supplementary information considered necessary to support the application.
| URN | Description | Reference | Contact | Remarks |
|---|---|---|---|---|
| urn:3GPP:vrstream:mp:video:basic | DASH profile identifier for VR Streaming Basic Video Media Profile | clause 5.2.2.3 of TS 26.118 | Thomas Stockhammer tsto@qti.qualcomm.com | none |
| urn:3GPP:vrstream:mp:video:main | DASH profile identifier for VR Streaming Main Video Media Profile | clause 5.2.3.3 of TS 26.118 | Thomas Stockhammer tsto@qti.qualcomm.com | none |
| urn:3GPP:vrstream:mp:video:advanced | DASH profile identifier for VR Streaming Advanced Video Media Profile | clause 5.2.4.3 of TS 26.118 | Thomas Stockhammer tsto@qti.qualcomm.com | none |
| urn:3GPP:vrstream:ve:<id> | Viewpoint Descriptor Scheme for Ensemble Signaling | clause 5.2.3.3.4 of TS 26.118 | Thomas Stockhammer tsto@qti.qualcomm.com | none |
| urn:3GPP:vrstream:presentation | DASH profile identifier for VR DASH Media Presentation | clause 8.3 of TS 26.118 | Thomas Stockhammer tsto@qti.qualcomm.com | none |
D VR metrics calculation examples |R16| p. 84
D.1 Comparable quality viewport switching latency p. 84
This sub-clause illustrates how the weighted average QR value and the effective resolution can be calculated.
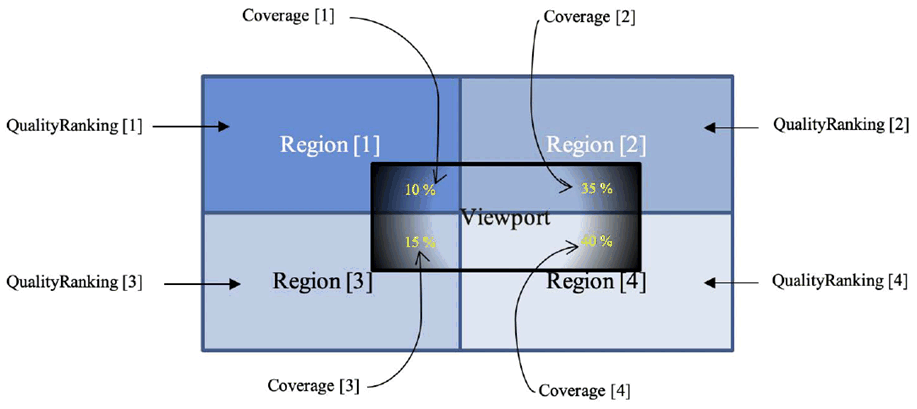
The quality level of each region is determined with its respective quality ranking (QR) value. A viewport can be covered with multiple regions. A quality level value for the viewport can be derived as weighted average of the QR values of the regions covering the viewport. The weight of each region is defined as the percentage of the viewport area covered by the corresponding region. The viewport quality level can be calculated by the following equation.
 N:
N:

Number of regions covering the viewport
QR[i]:
QR value of i-th quality ranking region
Coverage[i]:
The viewport coverage value (in percent) of i-th quality ranking region

Figure D.1-1: An example of a viewport covered by four quality ranking 2D region
(⇒ copy of original 3GPP image)
(⇒ copy of original 3GPP image)
Figure D.1-1 is an example of a viewport covered by four quality ranking regions. The quality of the viewport is equal to the weighted sum of the quality ranking value and the coverage percentage value of each quality ranking region.
The resolution of each region is determined by its respective width and height values in pixel which are available in the quality ranking box under the name orig_width and orig_height. Note that these values are already normalized to represent the full-sphere resolution you would get if the resolution of this region would be used for the full sphere.
The effective resolution (i.e. the total number of original pixels) for the content visible in the viewport can be derived as the weighted average of the resolution of each region covering the viewport. The weight of each region is defined by the percentage of the viewport area covered by the corresponding region. The effective viewport resolution can be calculated by the following equation.
 N:
N:

Number of regions covering the viewport
width[i]:
The width component of the original source pixel resolution for the i-th quality ranking region
height[i] :
The height component of the original source pixel resolution for the i-th quality ranking region
Coverage[i]:
The viewport coverage value (in percent) of i-th quality ranking region

Figure D.1-2: An example of a source packed image with four quality ranking 2D regions with different resolutions
(⇒ copy of original 3GPP image)
(⇒ copy of original 3GPP image)

Figure D.1-3: An example of a viewport covered by four different quality ranking 2D regions
(⇒ copy of original 3GPP image)
(⇒ copy of original 3GPP image)
Figure D.1-2 is an example of a source with four regions with different resolution. Figure D.1-3 represents an example of a viewport which is covered by the four quality ranking 2D regions. The effective viewport resolution is equal to the weighted sum of the resolution for each quality-ranking 2D region and its corresponding viewport coverage percentage value.

Figure D.1-4: Comparable quality viewport switching latency measurement example
(⇒ copy of original 3GPP image)
(⇒ copy of original 3GPP image)
Figure D.1-4 presents an example of the metric measurement operation. The viewport quality is evaluated at time t0, and then again at time t1. The media playback module renders the high-resolution sub-picture #1 at time t1. The user viewing orientation is gradually changing from sub-pic#1 to sub-pic#2 as the time progresses.
At time t2, the media playback module starts to render the buffered low-quality representation of sub-pic#2 as the viewport moves into sub-picture #2. At time t2, the viewport quality drops in values as compared to the viewport quality at time t1, and a new sub-picture (sub-pic #2) is rendered. A viewport switching event is identified at time t2.
The viewport quality values evaluated at t1 identifies the first viewport. The viewport position and viewport quality level list are assigned to the attributed Position and QualityLevel of the firstViewportItem.
An effective viewport resolution and viewport QR quality value for the new viewport that is comparable to that of the firstViewportItem after viewport switching time is logged at time t4. The new viewport position identifies the Position of the secondViewportItem. The corresponding QualityLevel list for the secondViewportItem is assigned.
The associated viewport values stored for the worst viewport quality during the switch is assigned to the field Position of the worstViewportItem. The corresponding QualityLevel list for the worstViewportItem is also assigned.
The comparable-quality viewport switching latency is measured as the time interval between the logged times for firstViewportItem (t1 in this example) and secondViewportItem (t4 in this example).
D.2 Rendered viewports p. 86
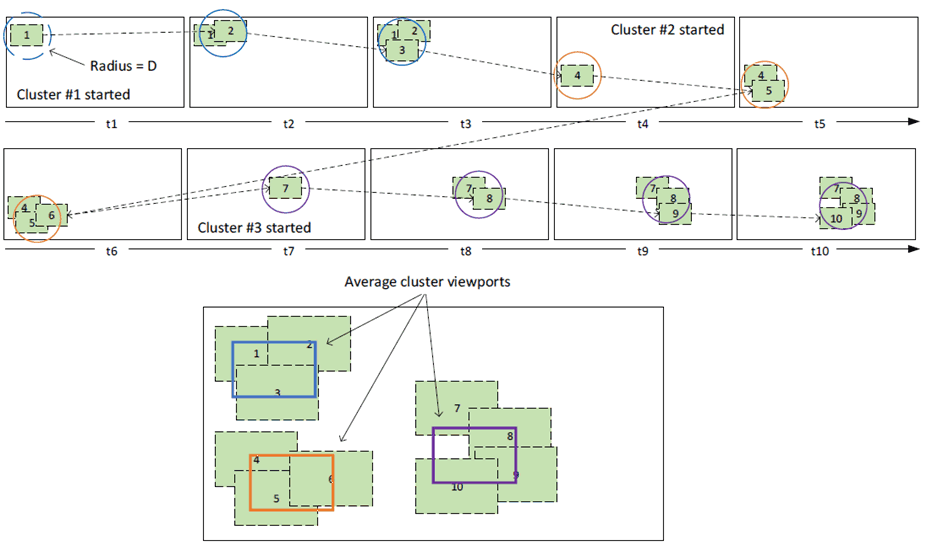
Figure D.2-1 illustrates an example of clustering and the associated viewports. The first three evaluated viewports are all with the distance D (indicated by the blue circle), and are thus assigned to the same cluster. Note that the cluster center moves a bit for each new viewport which is added to the cluster.
Viewport #4 is too far away from the center of cluster #1, and thus starts a new cluster, which eventually gathers three viewport members. Then viewport #7 is too far away from the center of cluster #2, and again starts a new cluster.

For each cluster j, the final averaged viewport parameters can be derived as follows, assuming there are N viewports in the j:th cluster. Note that the center azimuth and tilt averaging also needs to handle the special case around -180/180 degrees, as some values might be positive (e.g. 176 degrees), while others might be negative (e.g. -178 degrees). This special case is not shown in the equations below.
Note also that the azimuth and elevation range (i.e. the visible coverage of the viewport) might often be the same for every viewport, unless the user explicitly changes the field-of-view for the device. For consistency, and to catch any during-session field-of-view changes, these two parameters should still be averaged.
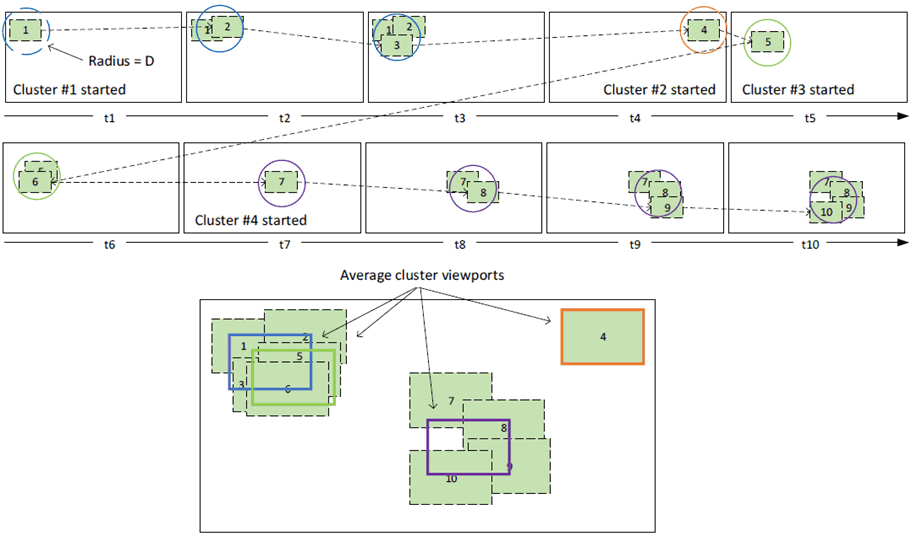
Figure D.2-2 below illustrates an example of the duration filtering. The user starts by looking at the upper left part of the media (viewports #1 to #3), then make a very brief glance to the right (viewport #4), and then moves back to the upper-left again (viewports #5 and #6). Then the user moves his gaze to the lower-right part (viewports #7 to #10).
Assume here that the duration T is set to 4 times the value of the viewport sample rate X, i.e. a cluster needs to have a duration corresponding to at least four viewports to be reported. Here four clusters are formed, but before filtering only cluster #4 would be reported. After filtering, clusters #1 and #3 are close enough both in time and distance to add to each other's aggregated duration, so each of them will be assigned an aggregated duration of 5, and thus be reported. Cluster #2, the quick glance up to the right, has too short duration and will not be reported.
