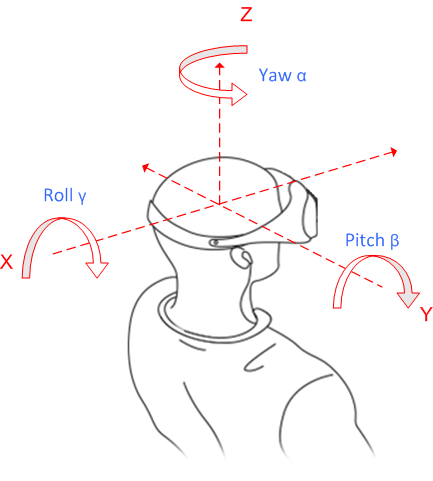
Figure 4.1-1 | Reference System |
Figure 4.1-2 | Coordinate system |
Figure 4.1-3 | Restricted coverage of the sphere region covered by the cropped output picture with omni_projection_{yaw | pitch | roll}_center the center of the coverage region |
Figure 4.1-4 | Video Signal Representation |
Figure 4.1-5 | Examples of Spherical to 2D mappings |
Figure 4.1-6 | Audio Signal Representation |
Figure 4.2-1 | architecture for VR streaming services |
Figure 4.3-1 | Client Reference Architecture for VR DASH Streaming Applications |
Figure 4.3-2 | Client Reference Architecture for VR Local Playback |
Figure 4.4-1 | Interoperability aspects for 3GPP VR Profiles |
Figure 4.5-1 | Block diagram of Common Informative Binaural Renderer |
Figure 5.1-1 | Video Operation Points |
Table 5.1-1 | High-level Summary of Operation Points |
Table 5.1-2 | Permitted combinations of spatial resolutions and frame rates |
Table 5.2-1 | Video Media Profiles |
Figure 6.1-1 | Audio Operation Points |
Table 6.1-1 | Overview of OMAF operation points for audio (informative) |
Table 6.2-1 | Audio Media Profiles |
Table 6.2-2 | MPEG-H Audio MIME parameter according to RFC 6381 and ISO/IEC 23008-3 |
Figure 9.2.1-1 | Client reference architecture for VR metrics |
Table 9.3.2-1 | ViewportDataType |
Table 9.3.2-2 | ViewportItem |
Table 9.3.2-3 | Comparable quality viewport switching latency metric |
Table 9.3.3-1 | Rendered viewports metric |
Table 9.3.4-1 | Device information |
Table A.2-1 | Selected permitted combinations of spatial resolutions and frame rates |
Table A.2-2 | Maximum Percentage of high-resolution area when assuming that the low-resolution area is encoded in 2k resolution, i.e. using 2048 × 1024 or 1920 × 960 and full coverage is provided for different frame rates |
Table A.2-3 | Maximum Percentage of coverage area for different frame rates |
Table A.2a-1 | Selected permitted combinations of spatial resolutions and frame rates |
Table A.2a-2 | Maximum Percentage of coverage area for different frame rates |
Figure A.1 | 3D XYZ coordinate definition |
Figure A.2 | Mapping of spherical video to a 2D texture signal |
Figure A.3 | Relation of the cube face arrangement of the projected picture to the sphere coordinates |
Table A.2-4 | Face index of CMP |
Figure B.1-1 | High level overview of an external binaural renderer setup. |
Table C-1 | 3GPP Registered URNs |
Figure D.1-1 | An example of a viewport covered by four quality ranking 2D region |
Figure D.1-2 | An example of a source packed image with four quality ranking 2D regions with different resolutions |
Figure D.1-3 | An example of a viewport covered by four different quality ranking 2D regions |
Figure D.1-4 | Comparable quality viewport switching latency measurement example |
Figure D.2-1 | Clustering example |
Figure D.2-2 | Duration filtering example |